Monitoring Websites use Knowledge Front HTTP Monitor Feb 5, 2013
Using Knowledge Front’s HTTP monitoring service is a simple, reliable and trusted way to externally monitor your websites. Our clients use the HTTP monitor to keep a close watch on their businesses’ websites hosted in a variety of environments:
- on-premise data centers
- 3rd party colocation sites
- PaaS providers such as Heroku and Google App Engine
- IaaS providers such as Amazon EC2, Rackspace, and Linode
Externally monitoring your websites provides insight into the responsiveness of your site from your customer’s perspective. The service provides the confidence in knowing that your support staff will immediately be notified of any service disruptions.
This tutorial will demonstrate how you can get a new HTTP monitor and alert configured in a few minutes. Our motto is “don’t wait to be proactive”… it doesn’t take much to go from not knowing about issues with your site to knowing immediately!
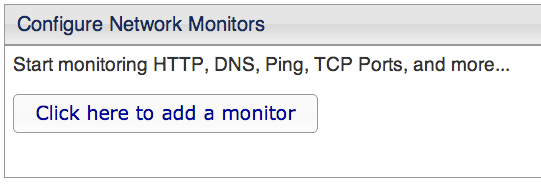
After logging into the Knowledge Front dashboard you can add a new
monitor using the guided process found under “Monitor Settings” ->
“Add a Monitor”: 
To start monitoring your web site we’ll elect to use the “Basic HTTP
monitor” from the growing list of monitors that Knowledge Front
provides: 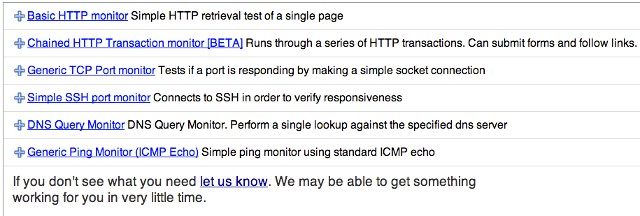
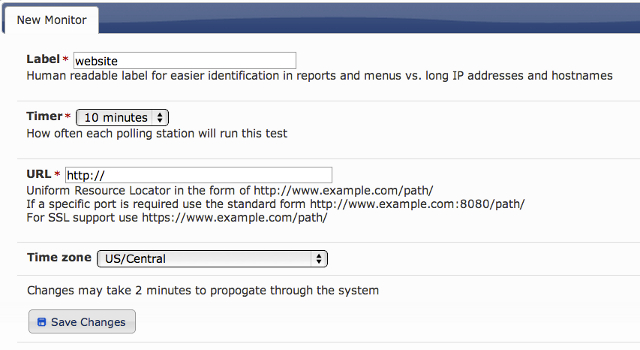
The basic inputs into the HTTP monitor are:
- Name of the monitor
- Testing interval
- Time zone
- URL of the site/resource to monitor
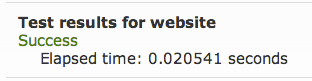
When you’re finished with the HTTP monitor configuration you can test
the monitor to receive immediate feedback, ensuring Knowledge Front’s
monitoring stations can reach your URL:
Next step, add an alert for your new monitor to receive immediate
notifications of any service disruption:
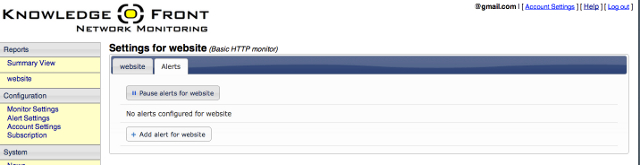
In this example, we’d like to know when our website is down and then
back up: 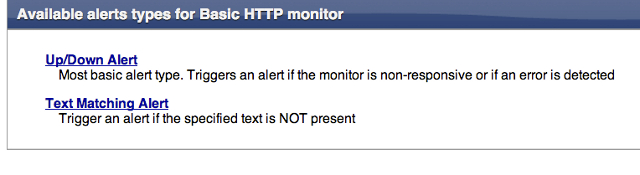
For every monitor you can specify an alert destination (e-mail, SMS) for
the alert notifications:

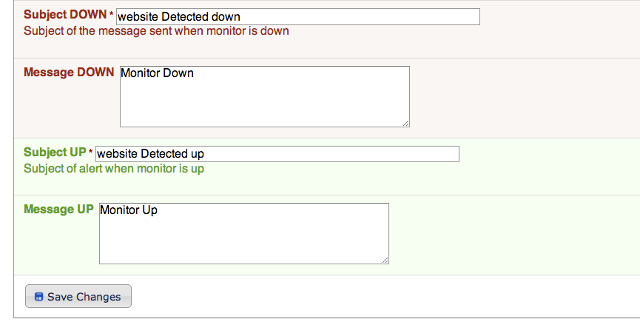
You have the freedom to customize the subject and message an alert will
send for both the “Down” and “Up” alerts:
If the HTTP monitor fails to reach your website, the “Down” alert you
configured will trigger and send an immediate notification to your
specified destination. In this example, we received a simple “Down”
e-mail: 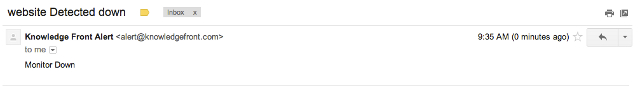
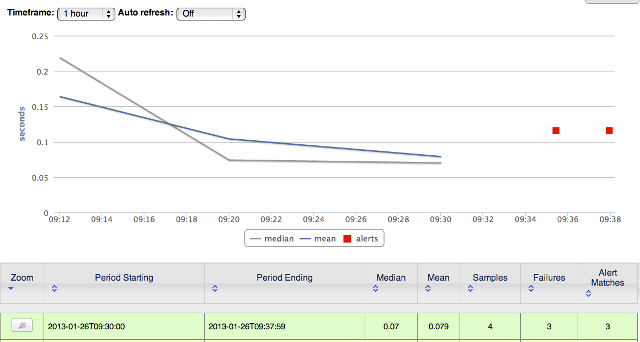
You can also view the monitor failures from the monitoring dashboard:
Once your website is back on-line and service is restored, the HTTP
monitor will confirm by sending the “Up” alert you configured to your
specific destination. In this case, we are receiving a simple “Up”
e-mail: 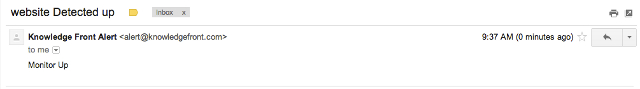
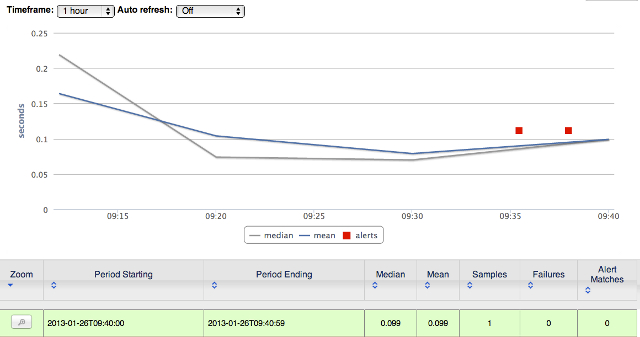
You should be able to refresh the monitor dashboard to see the latest
graph, including the successful attempts to reach your website:
Knowledge Front’s HTTP monitor can be used to watch over any number of your businesses’ web services:
- SaaS applications
- Marketing and sales websites
- Web-based APIs
For more information, please check out our HTTP monitoring help page at: http://www.knowledgefront.com/help/monitor/http.html
Or get in touch with us! We love talking about monitoring.
Knowledge Front Team